
- Anonymouskeyboard_arrow_down

Summary:
The Real Estate vs Stocks Calculator compares the long-term financial outcome of investing in real estate (leveraged via a mortgage) against investing the equivalent capital directly into a stock-market index fund.
The comparison is fair: both sides deploy identical cash The stock investor invests the down payment as a lump sum and mirrors the net monthly out-of-pocket cost of the real estate investor month by month.
Note: Mobile browsers have a simplified UI which may not contain all controls. For best experience, a desktop browser is recommended.
How to open the calculator:
- Navigate to the Calculators page using the main menu.
- Find Real Estate vs Stocks in the list and click the calculator icon.
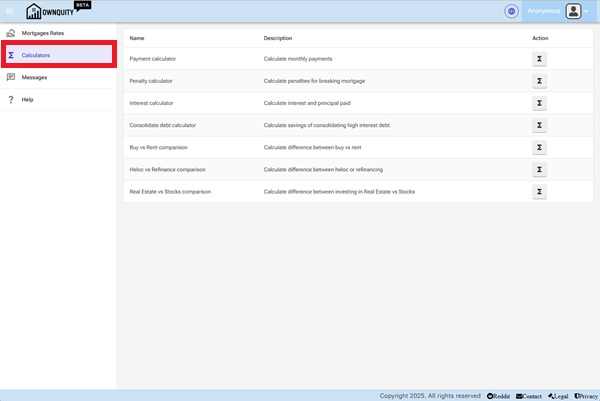
[Screenshot: Calculators page showing the list of available calculators]
Input Parameters:
| Parameter | Description |
|---|---|
| Home Price ($) | Full purchase price of the investment property. |
| Down Payment (%) | Percentage of the purchase price paid upfront. |
| Mortgage Rate (%) | Annual mortgage interest rate. |
| Amortization (Years) | Total amortization period of the mortgage. |
| Payment Frequency | How often mortgage payments are made. |
| Home Appreciation (% / yr) | Expected annual increase in the property's value. |
| Yearly Expenses ($) | Annual carrying costs: property tax, insurance, maintenance, etc. |
| Expenses Appreciation (% / yr) | Expected annual growth in carrying costs. |
| Monthly Rental Income ($) | Net monthly rental income (leave at 0 for an owner-occupied property). |
| Rental Income Appreciation (% / yr) | Expected annual growth in rental income. |
| Stock Return (% / yr) | Expected annual stock market return (e.g. 8% for a broad index fund). |
| Holding Period (Years) | Number of years to hold the investment before comparing outcomes. |
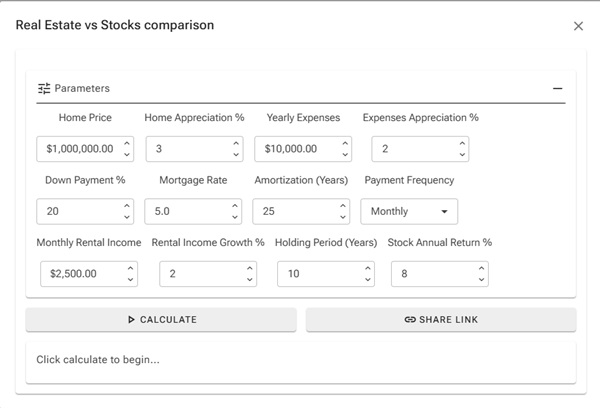
[Screenshot: Real Estate vs Stocks calculator with all inputs filled in]
How the comparison works:
Real estate side net gain:
Total Cash In ? Total Cash Out
- Cash Out: down payment + all mortgage payments + all carrying expenses.
- Cash In: net equity at sale (future property value ? remaining mortgage) + total rental income received.
Stock market side net gain:
Total Stock Portfolio Value - Total Capital Deployed
- The stock investor invests the same down payment as a lump sum on day 1, compounded at the stock return rate.
- Every month they also invest the same net out-of-pocket amount the real estate investor spends (mortgage + expenses ? rental income) into stocks as a monthly contribution.
- If rental income exceeds costs (positive cash flow), the real estate investor pockets that surplus; the stock comparison treats it as zero additional contribution.
- Capital deployed = down payment + sum of all monthly contributions.
This approach ensures both sides spend identical cash the only question is which grows more.
Reading the Results:
The Inputs Summary section restates all parameters and derived values.
The Real Estate Option section shows (with formula notes):
- Monthly mortgage payment
- Total mortgage payments, interest paid, principal repaid, remaining balance
- Total carrying costs (compounded annually)
- Total rental income received (if applicable)
- Future property value, remaining mortgage, net equity at sale
- Total cash out and total cash in
The Summary section shows both net gains colour-coded green (positive) or red (negative).
The Conclusion states which option performed better and by how much.
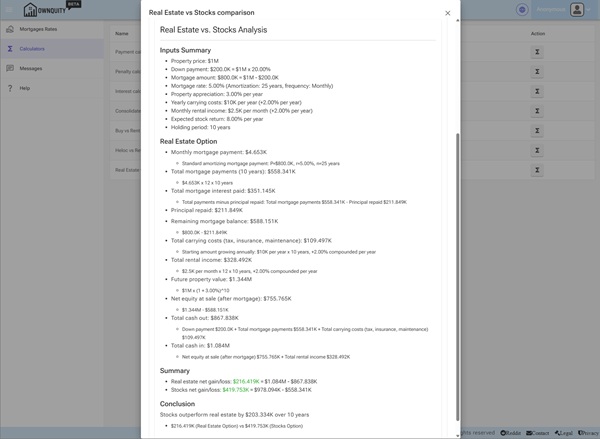
[Screenshot: Real Estate vs Stocks results showing both options and the conclusion]
Tips:
- Leverage amplifies both gains and losses. A highly appreciated property with a small down payment can dramatically outperform stocks; a flat or declining market can dramatically underperform.
- Rental income significantly shifts the comparison in real estate's favour by reducing net monthly cash outflow and creating a second income stream.
- Higher stock return assumptions (12%+) tend to favour stocks; realistic long-term index returns of 6-8% often make real estate competitive for leveraged purchases in appreciating markets.
- Transaction costs (legal fees, land transfer tax, realtor commissions) are not included. These materially reduce the real estate return, especially for short holding periods.
- Use the Share Link button to save or share a specific scenario.
Additional Information:
- See the Buy vs Rent Calculator help article for a simpler owner-occupied comparison.
- See the Payment Calculator help article to understand the mortgage payment calculation in detail.