
- Anonymouskeyboard_arrow_down

Summary:
The Buy vs Rent Calculator compares the financial outcome of buying a home against renting and investing the down payment instead.
Both options are measured over the same holding period so the net financial position of each can be compared fairly.
Note: Mobile browsers have a simplified UI which may not contain all controls. For best experience, a desktop browser is recommended.
How to open the calculator:
- Navigate to the Calculators page using the main menu.
- Find Buy vs Rent in the list and click the calculator icon.
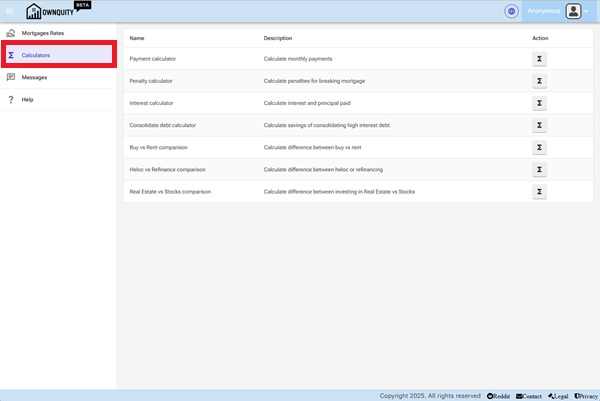
[Screenshot: Calculators page showing the list of available calculators]
Input Parameters:
| Parameter | Description |
|---|---|
| Home Price ($) | The purchase price of the property. |
| Down Payment (%) | The percentage of the purchase price paid upfront. |
| Interest Rate (%) | The annual mortgage interest rate. |
| Amortization (Years) | The full amortization period of the mortgage. |
| Home Appreciation (% / yr) | Expected annual growth in the property's value. |
| Yearly Expenses ($) | Annual carrying costs: property tax, insurance, maintenance. |
| Expenses Appreciation (% / yr) | Expected annual growth in carrying costs. |
| Monthly Rent ($) | The equivalent monthly rent for a comparable property. |
| Rent Growth (% / yr) | Expected annual increase in rent. |
| Investment Return (% / yr) | Expected annual return if the down payment were invested instead. |
| Length of Stay (Years) | How many years to hold and compare both scenarios. |
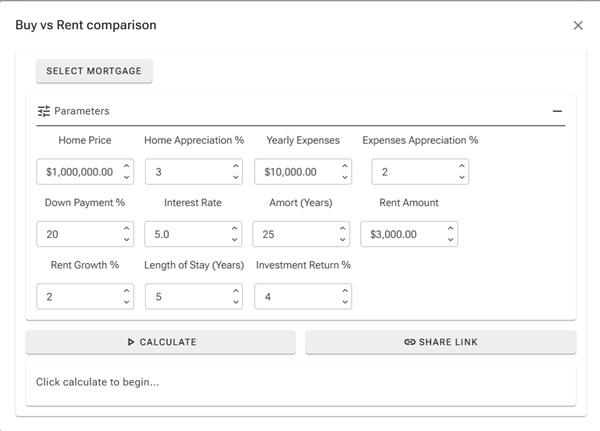
[Screenshot: Buy vs Rent calculator with all inputs filled in]
How the comparison works:
Buying side net gain:
Net Equity at Sale - Down Payment - Total Mortgage Payments - Total Property Expenses
- The buyer sells at the future property value, repays the remaining mortgage, and keeps the equity.
- All cash spent (down payment, mortgage payments, property expenses) is deducted.
Renting side net position:
Investment Growth - Total Rent Paid
- The renter invests the down payment at the expected return rate for the full period.
- All rent paid is deducted from the investment value.
This makes the comparison fair: both sides started with the same capital (the down payment).
Reading the Results:
The Inputs Summary section restates all parameters and derived values (mortgage amount, actual down payment in dollars).
The Buying Analysis section shows:
- Monthly mortgage payment (with formula: P, r, n)
- Total mortgage payments, interest paid, principal/equity accrued
- Total property expenses (compounded annually)
- Future property value, remaining mortgage balance, net equity at sale
- Total cash out vs. total cash in
The Renting Analysis section shows:
- Total rent paid (compounded annually)
- Investment growth of the down payment
The Summary section shows both net gains colour-coded green (positive) or red (negative).
The Conclusion states which option is better and by how much.
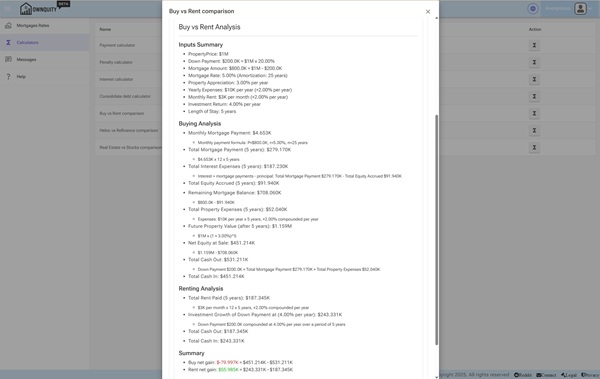
[Screenshot: Buy vs Rent results showing the full breakdown and conclusion]
Tips:
- A higher property appreciation rate strongly favours buying; a higher investment return rate favours renting.
- The longer the holding period, the more mortgage principal you repay and the more appreciation accumulates, generally favouring buying.
- Carrying costs (property tax, maintenance, insurance) are often underestimated; include realistic figures for an accurate comparison.
- Use the Share Link button to save or share a specific scenario.
Additional Information:
- See the Real Estate vs Stocks Calculator help article for a more detailed investment-focused comparison including rental income.
- See the Payment Calculator help article to model your mortgage payment in detail.