
- Anonymouskeyboard_arrow_down

Summary:
This article shows how you can add a dashboard to your account.
Dashboards are chart widgets that help track your financial status over time.
They can provide historic data as well as future projections on:
- Your networth over time
- Prime rates over time
- Home price index for areas of interest
- Your home value over time as calculated using home price index in the area.
- Total mortgage remaining for all mortgages.
- Total Principal paid for all mortgages
- Total interest paid for all mortgages
- Cashflow over time
Note: Mobile browsers have a simplified UI which may not contain all controls. For best experience, a desktop browser is recommended.
Steps to add a dashboard:
- Navigate to the "Financial Dashboards" page using the main menu.
- Click on the "Add Dashboard" tile
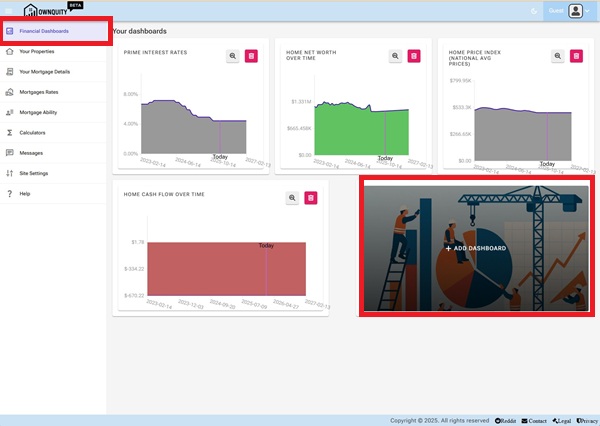
- Select the dashboard of interest
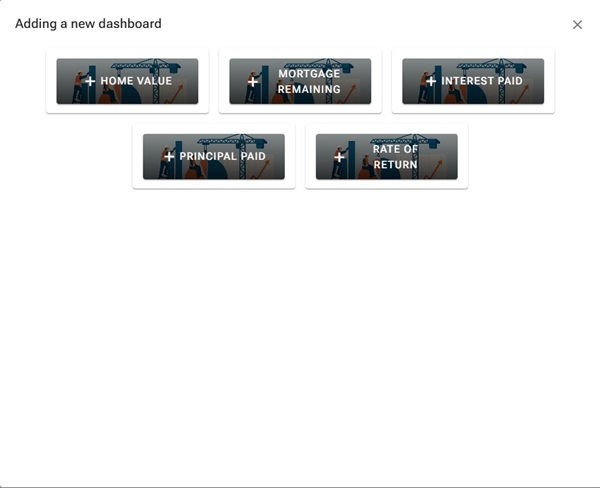
Note 1: Once a dashboard is added, it will be removed from choice of new dashboards to add
Note 2: The add dashboard button will not be shown if all dashboards are added
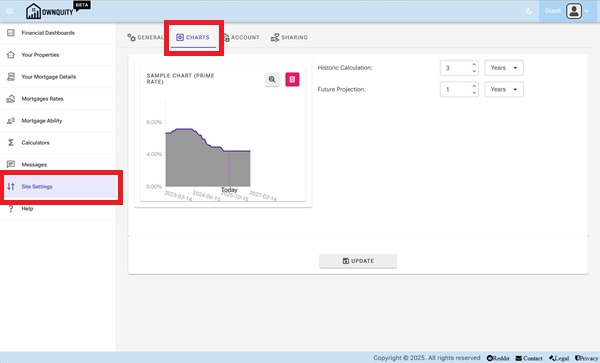
Updating Dashboard Settings:
Each dashboard uses Chart settings that can be changed under site settings.
Navigate to the site settings, and the charts tab.
Here you can update the default history for the dashboard charts.
Additional Information:
- See Adding Mortgage article on how to add mortgages against your home.
- See Home Calculations article on what calculators are available with your home.
- See Home Chart article on how to interpret the generated charts for your home.